
Journals
-
A+BE | Architecture and the Built Environment
Open access doctoral thesis series on Architecture and the Built Environment.
-
European Journal of Transport and Infrastructure Research
The European Journal of Transport and Infrastructure Research (EJTIR) is a peer-reviewed scholarly journal, freely accessible through the internet.
ISSN: 1567-7141
-
International Journal of Water Governance
The International Journal of Water Governance (IJWG) aims to be an important source of knowledge on governance in the domain of water and water-related issues. It was previously published from Erasmus University Rotterdam, and currently a co-production by Wageningen University, TU Delft and Deltares.
-

FOOTPRINT
Footprint is an academic journal dedicated to publishing architecture and urban research. The journal promotes the creation and development – or revision - of conceptual frameworks and methods of inquiry. It is engaged in creating a body of critical and reflexive texts with a breadth and depth of thought which would enrich the architecture discipline and produce new knowledge, conceptual methodologies and original understandings.
-
Journal of Coastal and Hydraulic Structures
The Journal of Coastal and Hydraulic Structures (JCHS) is a completely free and open access community-based journal (diamond-open-access). All papers are rigorously peer-reviewed research in a double-blind fashion. Its mission is to publish high level engineering science results focused on the field of coastal and hydraulic structures.
-
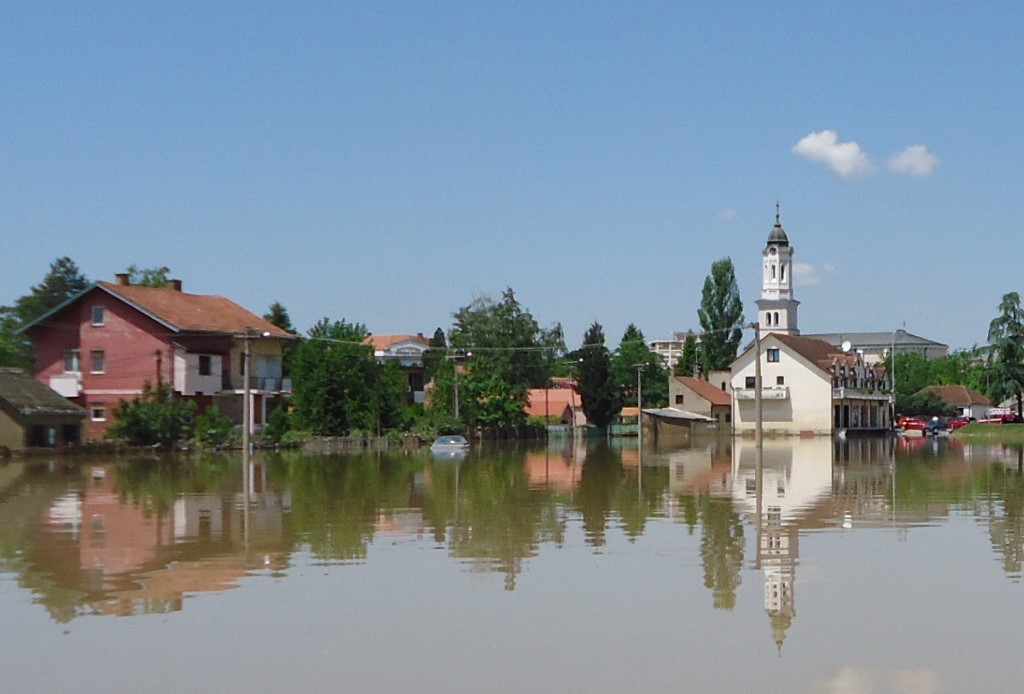
Journal of Delta Urbanism
Delta Urbanism is a line of work in which flood protection, soil and water management strategies are synergized with urban design, landscape architecture and spatial planning.
-
Journal of Coastal and Riverine Flood Risk
The Journal of Coastal and Riverine Flood Risk (JCRFR) is a completely free and open access community-based journal. All papers are rigorously peer-reviewed research in a double-blind fashion. Its mission is to publish high level engineering science results focused on the field of coastal and riverine flood risk.
-

Journal of Human-Technology Relations
The Journal of Human-Technology Relations (JHTR) is an Open Access journal, investigating the relations between human beings and technologies from an interdisciplinary perspective.
-
Journal of Integrated Security and Safety Science
The Journal of Integrated Security and Safety Science (JISSS) publishes innovative papers that offer a significant contribution – conceptual, theoretical, methodological, or empirical – to all areas of physical security and safety in industries and infrastructures.
-
Journal of Open Aviation Science
Journal of Open Aviation Science is an open-access peer-reviewed journal, established by researchers for researchers. It promotes high quality open science, open data and reproducible scientific research for aviation. In addition to original scientific research, we welcome replication of existing research publications using open source implementations and open data. Particularly, we welcome contributions comparing the performance of reference models with their open source counterparts.
-

Journal of Standardisation
Standardisation is a multidisciplinary research field and therefore contributions from diverse fields are welcomed. The journal welcomes contributions on various topics as long as the link to standardisation is clearly studied.
-
Journal of Supply Chain Management Science
The Journal of Supply Chain Management Science (JSCMS) is a peer-reviewed open-access journal (with no publishing fees) that aims to publish high-quality papers on quantitative approaches to supply chain management.
-
The Evolving Scholar
The Evolving Scholar is an open access community-driven journal that supports open peer review and novel types of publications. The Evolving Scholar rethinks publishing together with the researchers.
-

Superhero Science and Technology
Superhero Science and Technology publishes articles on new and novel research from science, technology, engineering and ethics with the articles motivated by the superhero genre.
-

Writingplace
The Writingplace journal is a peer-reviewed, international journal on architecture and literature. By acknowledging the possibilities of literature as a field of academic research, Writingplace investigates the productive connections between architecture and literature, literary methods and architectural imaginations.
-

Student Undergraduate Research E-journal!
Discontinued journal. Archives are available.
-
DASH | Delft Architectural Studies on Housing
DASH (Delft Architectural Studies on Housing) is a thematic serial that is wholly devoted to dwelling design. Inquiry into historical and contemporary projects and conditions is the central focus of DASH. New types of housing but also existing models and changing trends are thoroughly charted and examined. The target is the future: with thought-provoking analyses, DASH aims to give new impetus to innovative housing design.
-
International Planning History Society Proceedings
The International Planning History Society (IPHS) is dedicated to the enhancement of interdisciplinary studies in urban and regional planning history worldwide.
